

I stumbled across this article a few weeks ago, and kept it open in my browser until I could come up with something (semi-) useful to do with it: Plotting data in the terminal with gnuplot…
I had done some work last year at ERLPhase to analyze some data, including doing FFTs, etc. I played around and did a comparison between JPEG graphics and text graphs. Check it out!
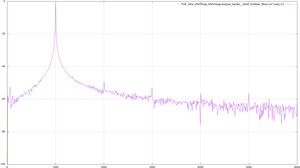
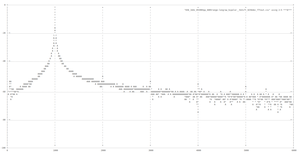
The secret to doing a text plot is in the two statements:
set terminal dumb 250 60
plot FftFileName using 2:5 with linespoints
Where the output is 250 characters wide x 60 lines high, and the input data is in the file FftFileName.
I don’t know why, but I find that just… fascinating… wow!